3. Fire Progression Mapping
Machine learning methods will be developed that utilize dense time-series of C-band SAR (Sentinel-1) and optical (Sentinel-2) data to map the evolving burn scar as the wildfire progresses. The C-band data will help overcome the limitations of optical data by being able to penetrate smoke and clouds. The aim is to demonstrate a proof of concept of an integrated system that uses every available SAR and cloud-free optical image to provide rapid fire progression mapping.
We aimed to develop fire progression methods for C-band SAR (Sentinel-1) and optical (Sentinel-2) data, to compare the outputs of each method to the manually derived polygons generated by University of Wollongong which are treated as the independent source of truth and assess how much additional coverage and accuracy is gained by supplementing the optical outputs with the SAR outputs.
Optical Sensors (Sentinel 2/Landsat7/8)
Method
Fire Extent and Severity Mapping (FESM) is an operational statewide mapping program, with capability to deliver fire mapping products derived from satellite imagery in near-real time (DPE 2021). The method is described in our previous publications Gibson et al (2020) and Gibson et al (2023), but briefly, the model has been developed and tested on over half a million data points. The training and validation dataset took fire severity classification samples from interpreting high resolution aerial photography. Reflectance values from satellite imagery (Sentinel 2 and Landsat) were collected at each sample data point, and a suite of indices were generated. The indices include the differenced normalised burn ratio (dNBR), the relativised dNBR (RdNBR), as well as fractional cover and image texture-based indices.
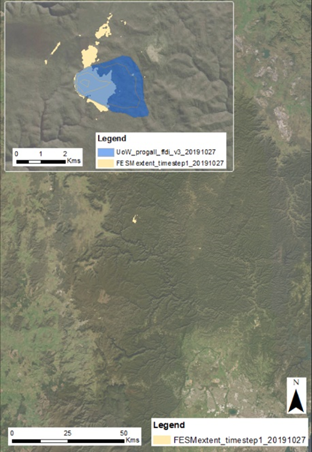
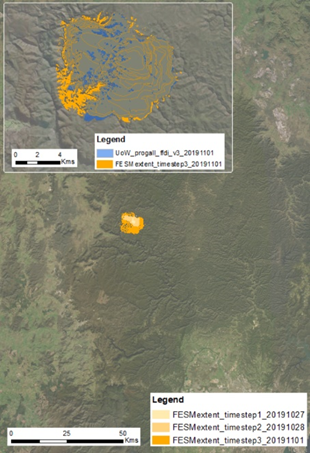
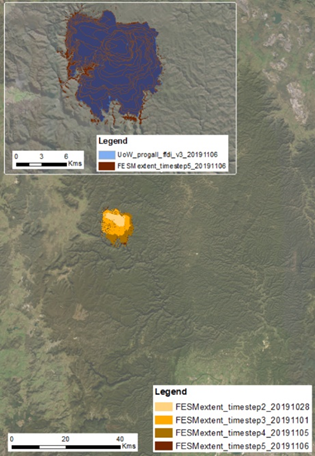
For the fire progression method, we selected every available image from the Sentinel 2, Landsat 7 and Landsat 8 satellite constellations with a threshold of <50% cloud cover between the fire start date (26/10/2019) and end date (20200210) for the Gospers Mountain fire in the Blue Mountains (Table 1). For each image time step, the FESM algorithm was applied, using corresponding pre-fire image. In most cases, the algorithm was run a second time following refinement of the input parameters such as the unburnt training data, to be more localised to the adjacent burnt area. The extent perimeter was generated from amalgamating the severity classes, excluding the modelled unburnt.
The optical fire progression outputs were visually compared to an independent fire progression validation dataset (‘UoW progall’) that has been provided for our study by Prof. Owen Price, University of Wollongong. This dataset was manually developed from Incident Management Teams hand digitised line work during the active fire, by examining linescan images, and supplemented with active hotspot detection data to populate the date/time fields where date/time was otherwise unknown. Manual cleaning and refinement of this dataset was undertaken over an intensive 3 month period following the 2019-20 fires, to provide input into analyses for submissions to the NSW Bushfire Inquiry by the NSW Bushfire Risk Management Research hub (now the NSW Bushfire & Natural Hazards Research Centre).
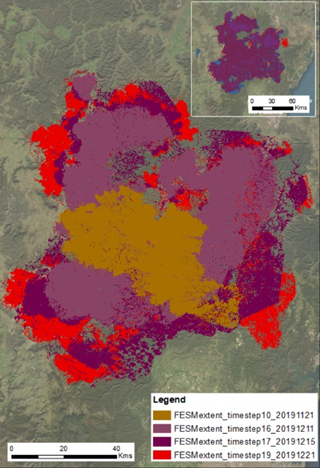
Preliminary Results
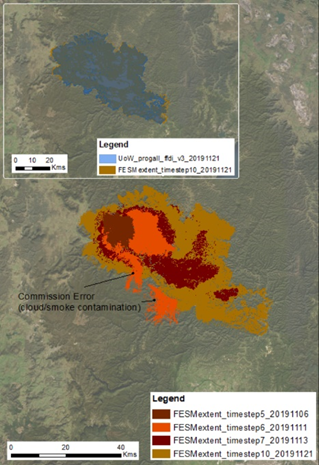
The following set of image panels display the preliminary results. The timesteps can be cross references with Table 1 for details on the number of days between timesteps and the quality of the input imagery. In most cases, there is remarkable alignment between the FESM-derived outputs and the independent fire progression validation dataset. There are several examples of commission and omission error. Furthermore, many timesteps of all available imagery did not produce meaningful outputs due to extensive cloud and smoke contamination (see Table 1). This is where we hope the SAR methods can fill the gaps to achieve a near-daily snapshot of fire progression.