4. NSW Fire Extent and Severity Mapping (FESM)
Using a combination of high-resolution satellite imagery and machine learning, remote sensing scientists at DCCEEW routinely map the severity of fires in NSW, aiding partners in conservation and fire management.
The severity classes represent ecologically meaningful definitions based on levels of canopy scorch and consumption (see Table 1).
Table 1: FESM fire severity classification
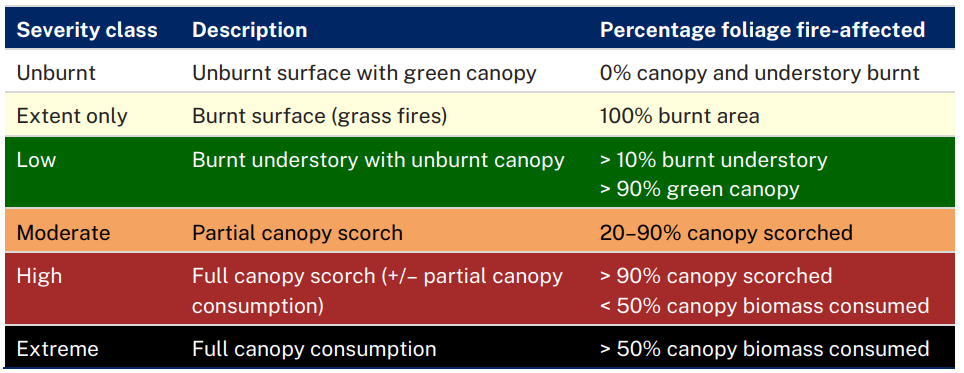
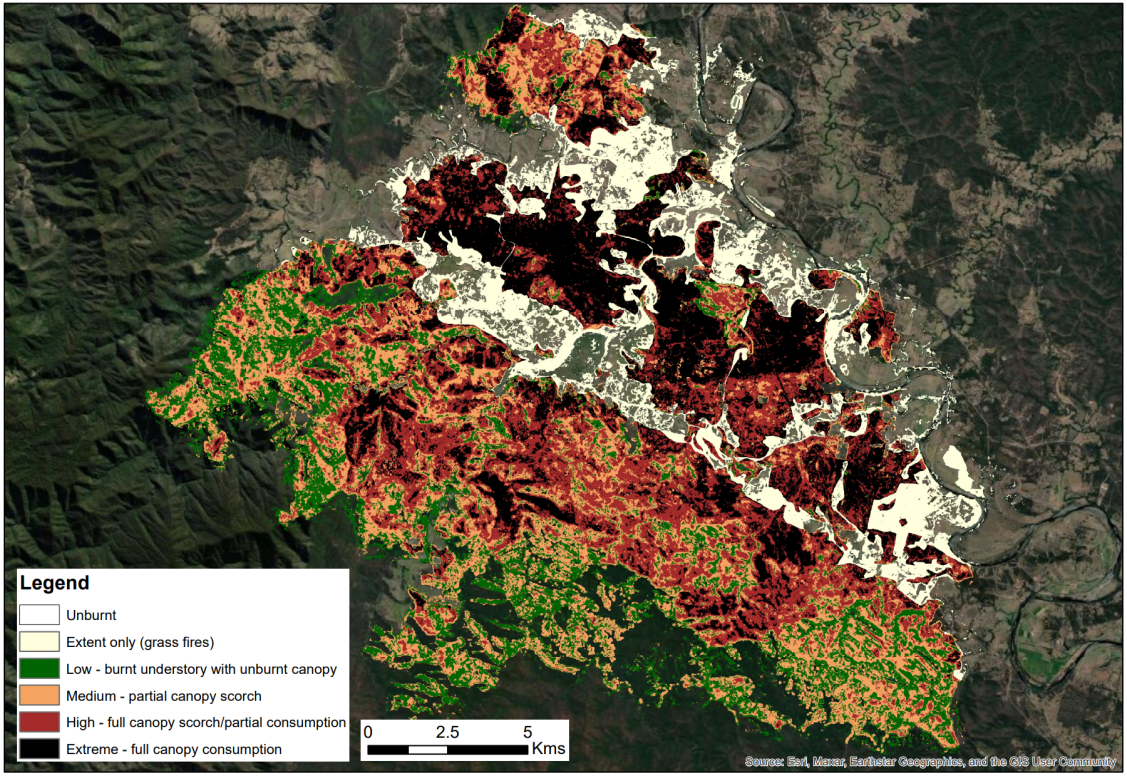
Figure 1 Example FESM map
FESM Dashboard
From the 2025-26 fire year, near real-time FESM data for wildfires are published through each fire season. Analytics are presented in a live dashboard. To access the data and analytics, see Near Real-Time FESM for Wildfires.
Historical FESM Archive (1989-90 to 2015-16)
The NSW FESM program also uses imagery from Landsat satellites to produce state-wide fire maps over recent past decades. Compiling FESM data across a timeseries assists with fire and ecological analyses over longer timeframes, to better understand change over time and cumulative impacts. However, inherent sensor differences need to be considered. We have rigorously assessed the performance of FESM algorithms trained on Sentinel 2 compared to Landsat platforms. Our independent accuracy assessment demonstrated very similar levels of accuracy for both sensor algorithms.

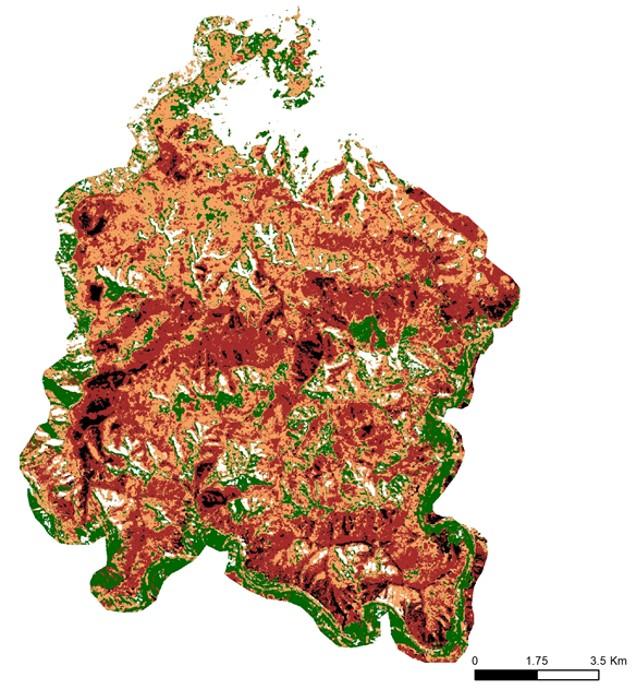
Figure 2 Comparison of FESM based on Sentinel 2 (left) and Landsat 8 (right) satellites.
The published paper contains more detailed information:
The FESM statewide and historical datasets are available on SEED, see links below.
For more information, see Remote Sensing of Fire.
Linked Datasets
Fire severity is a metric of the loss of biomass caused by fire. In collaboration with the NSW Rural...
- SEED Web Map
- arcgis_rest
- TXT
Fire severity is a metric of the loss of biomass caused by fire. In collaboration with the NSW Rural...
- URL